
A Dynamical Simulation of the Syrian Refugee Crisis
As of this year, there are approximately 68 million internally displaced persons and 46 million refugees across the world. People may be forced to leave their homes due to political upheavals, wars, and other dangers; these individuals are defined as “internally displaced” while they remain within their countries of origin, and officially become “refugees” if they migrate across national borders. In particular, the Syrian refugee crisis has been occurring at an immense scale — since 2011, approximately seven million refugees have fled Syria due to the ongoing civil war.
During a contributed presentation at the 2024 SIAM Annual Meeting, which was held earlier this month in Spokane, Wash., Danilo Diedrichs of Wheaton College described the development of a dynamical model that quantifies the influence of different factors on refugees’ decisions to migrate to particular locations, based on data from the Syrian refugee crisis [1]. Diedrichs partners with the United Nations High Commissioner for Refugees, which offers humanitarian assistance and facilitates asylum, repatriation, and resettling for refugees. “They have a lot of data on the Syrian refugee crisis,” Diedrichs said. “It’s very well documented.”
As Diedrichs explained, the mathematical model only considers refugees—not other migrants or internally displaced persons—and tracks all of the pathways that people might take into or out of that status. It currently ignores modes and routes of transportation, though there are plans to include those factors in future versions. The particular form of the model is a discrete graph dynamical system that simulates spatial movement between a list of specific countries over a one-year time step. Syria is the source of refugee movement in the model, and individuals who depart from Syria may then migrate between other countries. The sink terms in the simulation account for the loss of refugee status due to gaining asylum in a host country, repatriation to Syria, or attrition.
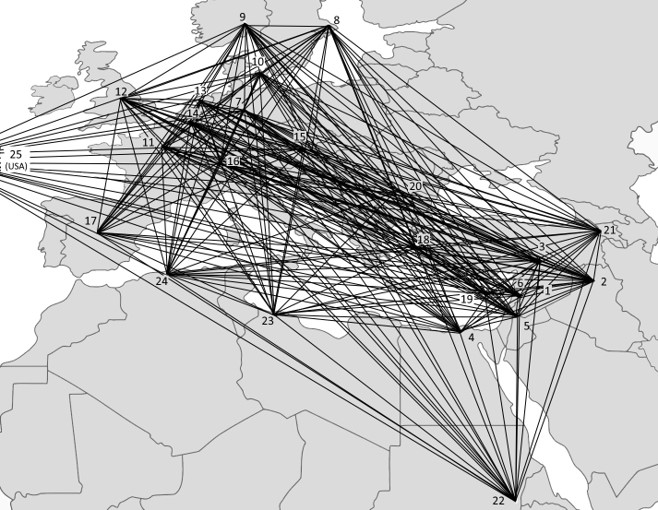
The model encompasses 25 vertices, including Syria (the source) and 24 other countries that host refugees from Syria (see Figure 1). Tracking the number of refugees in each country between the years of 2010 and 2020 leads to 312 variables. There are also 24 dynamic equations—one for each country besides Syria—that add the source and migration terms and subtract the sink terms. Diedrichs stated that the most interesting consideration in the model is the migration parameter: the proportion of refugees who will decide to migrate from one particular country to another the following year. To represent all of the possible combinations of origin and destination countries, the model includes 600 migration parameters in total.
“The unique thing about this model is that it’s a push-and-pull model that looks at the factors refugees use to decide whether to migrate, and when,” Diedrichs said. Many different influences impact these crucial decisions. “You have the cost, the danger, the quality of life, cultural familiarity, and more,” Diedrichs continued. Inertia may lead people to remain where they are, while the presence of family or community members may attract refugees to a particular place.
To make the model more tractable, Diedrichs came up with a list of five relevant, weakly correlated attributes that impact each country’s appeal: gross domestic product, political stability, societal violence, dominant language, and location. “How important is one attribute versus another when refugees consider different destinations?” Diedrichs asked.
By computationally fitting the model to data in MATLAB, Diedrichs determined the optimum set of weight parameters to represent each attribute’s relative impact on the migration flow; language ranks at the highest importance, while gross domestic product ranks at the lowest. These weight parameters are incorporated into the overall comparative attractiveness scores between each pair of countries in the network. The model also includes an inertia parameter, which represents people’s tendency to remain in one place. If a simulated refugee overcomes this inertia, their choice of destination is determined by the countries’ relative attractiveness scores.
Diedrichs presented an example of forecasting whether a Syrian refugee who is currently in Iraq will choose to migrate to the U.K., Greece, or Armenia; one can plug the relevant parameters into the model to find the probabilities of where this person will decide to go if they overcome their inertia. The U.K. comes out on top with the highest probability, at 47 percent.
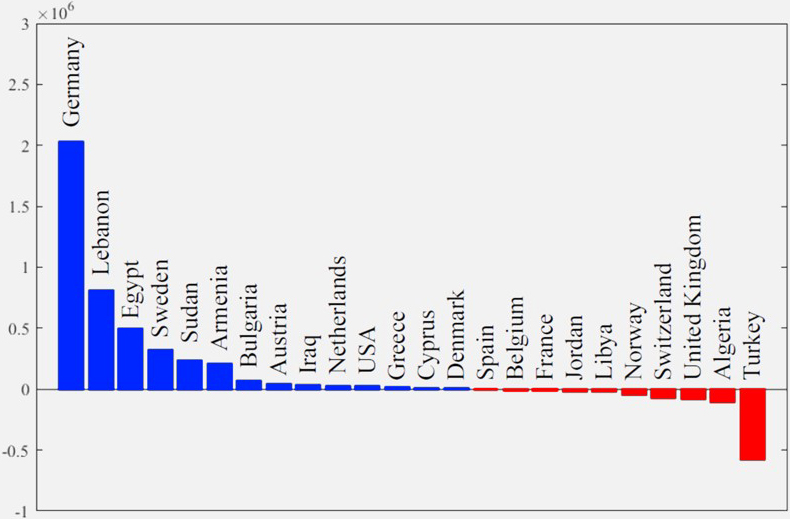
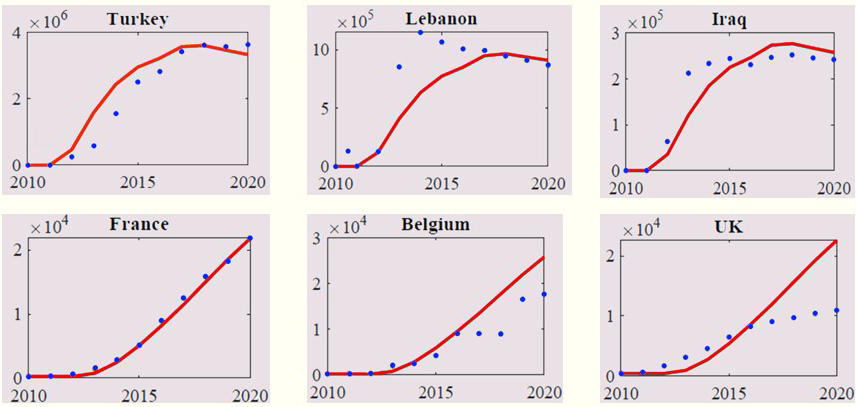
Figure 2 compares the simulation’s output to data on the refugee populations in several nations; it fits well for some countries, such as France, but sometimes under- or overpredicts for others. Figure 3 displays the error in the model’s fit to data from a variety of countries. “Here, we can hypothesize why the model doesn’t perform as well,” Diedrichs said. For example, the model does not currently account for the impact of policies such as Germany’s welcoming culture towards refugees or situations like Egypt’s backlog of processing refugees, which leads it to underpredict the populations in those locations. The model also overestimates the number of refugees in countries like Switzerland and the U.K.—which have tighter immigration restrictions—as well as Turkey, which allows some individuals to resettle quickly and thus no longer be officially considered “refugees.”
Overall, the data from the Syrian refugee crisis provided Diedrichs with the necessary framework to create a mathematical model that could also be useful for exploring other refugee crises around the world. Future refinements will add more possible destinations within each country, include more specific personal traits, and incorporate different aspects of transport and the influence of group dynamics. “We can use this as a modeling tool to help policymakers be proactive—rather than reactive—to refugee crises,” Diedrichs said.
References
[1] Diedrichs, D.R., Hill, A., Li, Y., & Miller Schubert, A. (2024). Dynamical simulation of the Syrian refugee crisis: Quantifying the driving factors of forced migration. Simulation, 100(2), 157-170.
About the Author
Jillian Kunze
Associate Editor, SIAM News
Jillian Kunze is the associate editor of SIAM News.


Stay Up-to-Date with Email Alerts
Sign up for our monthly newsletter and emails about other topics of your choosing.
