Linear Regression Model Forecasts Water Consumption Trends in the Vicinity of Zion National Park
The small town of Springdale in Washington County, Utah, is located just outside the boundary of Zion National Park. Despite its modest population of less than 600 people, Springdale’s proximity to Zion—which attracts more than five million visitors each year—intimately connects the town with the tourist industry. Anyone who utilizes Zion’s South Entrance must pass through Springdale, and tourists frequently make use of its restrooms, stores, restaurants, hotels, and other accommodations before entering the park. “This is a problem for Springdale because the small community must account for a large influx of visitation,” Rachel Krupnek of Utah Tech University said.
One direct outcome of high visitation numbers is increased water consumption. At present, Springdale collects approximately 115 million gallons of water per year across all water treatment sources (though its actual water right is much higher than that). In 2023, the town’s collective usage totaled 89 million gallons: 70 million gallons for commercial, 16 million for residential, and three million for institutional purposes. “Commercial water usage is definitely the biggest factor, which is coming from visitation,” Krupnek said. Given the continued inpouring of tourists, authorities are wondering whether Springdale’s water system can withstand the heightened demand.
During the 2024 SIAM Annual Meeting, which is currently taking place in Spokane, Wash., Krupnek shared her group’s efforts to forecast water consumption trends in Springdale based on changing visitation patterns and capacity constraints at Zion National Park. This work was part of the Preparation for Industrial Careers in Mathematical Sciences (PIC Math) program of the Mathematical Association of America and SIAM, with support from the National Science Foundation.
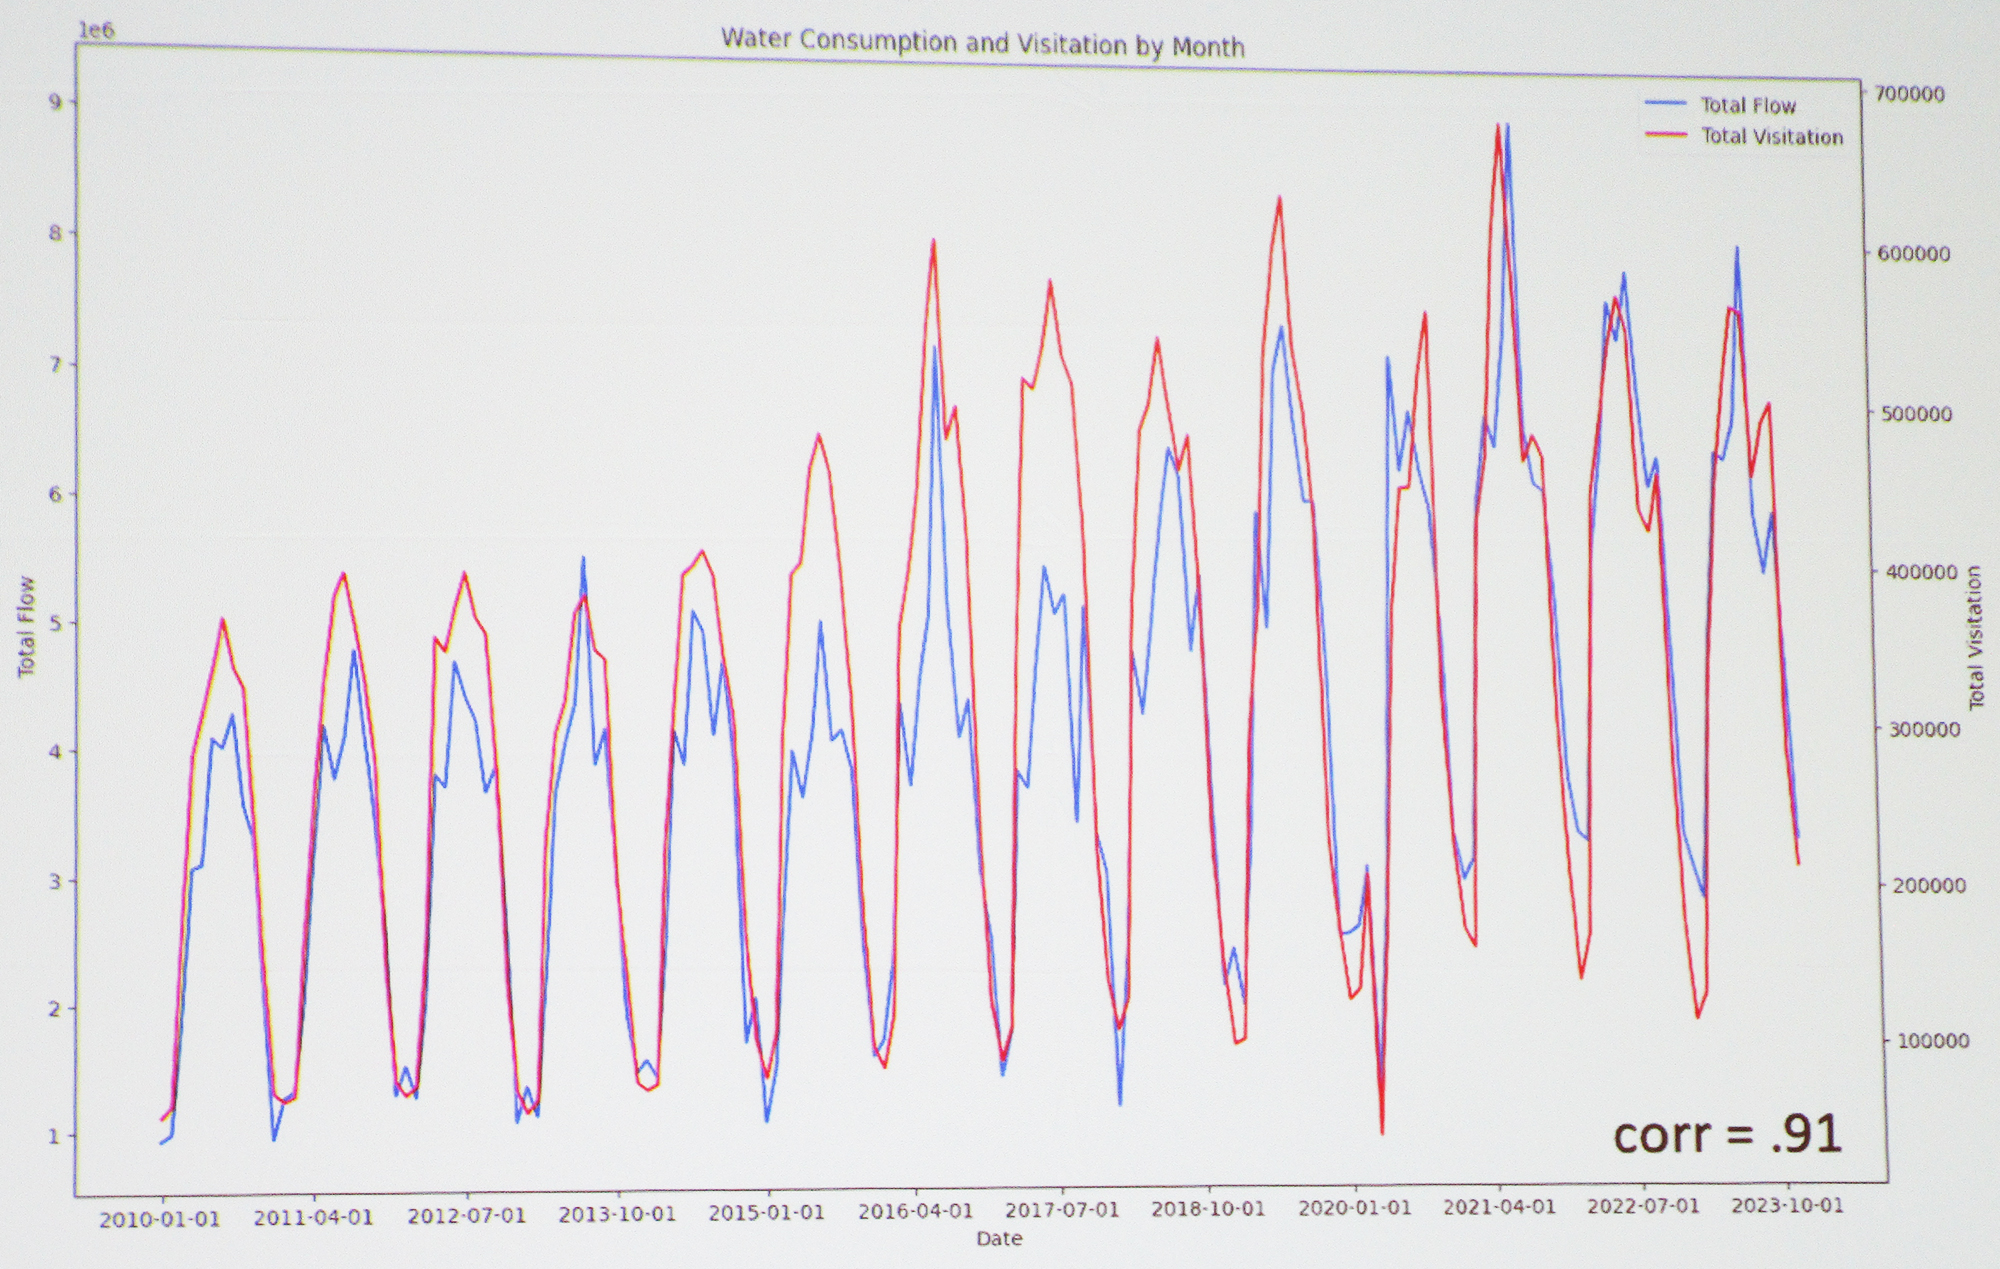
Krupnek began by examining historical water consumption and visitation trends in Springdale. Both measures have increased steadily over the last 25 years, with a peak consumption of nine million gallons in 2021. Overlaying the two graphs demonstrates the factors’ strong correlation and confirms that water consumption is indeed dependent on visitation (see Figure 1). Given this corroboration, Krupnek employed a linear regression model to generate predictive scenarios for water consumption over the next six years. Although she and her team initially considered a Holt-Winters model—which puts greater emphasis on more recent observations—they ultimately decided that its projected level of growth was unsustainable and unrealistic.
Krupnek used data from 2010 to 2019 to fit the regression model, as numbers from 2020 onward were inconsistent due to COVID-19. She accounted for seasonality and utilized random normal distribution to add white noise to the forecast. The model closely followed existing observations, and an R-squared value of 0.85 indicated a good fit. Next, Krupnek plotted a base case, aggressive case, and conservative case for water consumption based on historical visitation monthly growth rates (see Figure 2). Even with linear regression, the unchecked growth of all three cases would become unsustainable rather quickly — especially in the highly-trafficked months of June, July, and August.
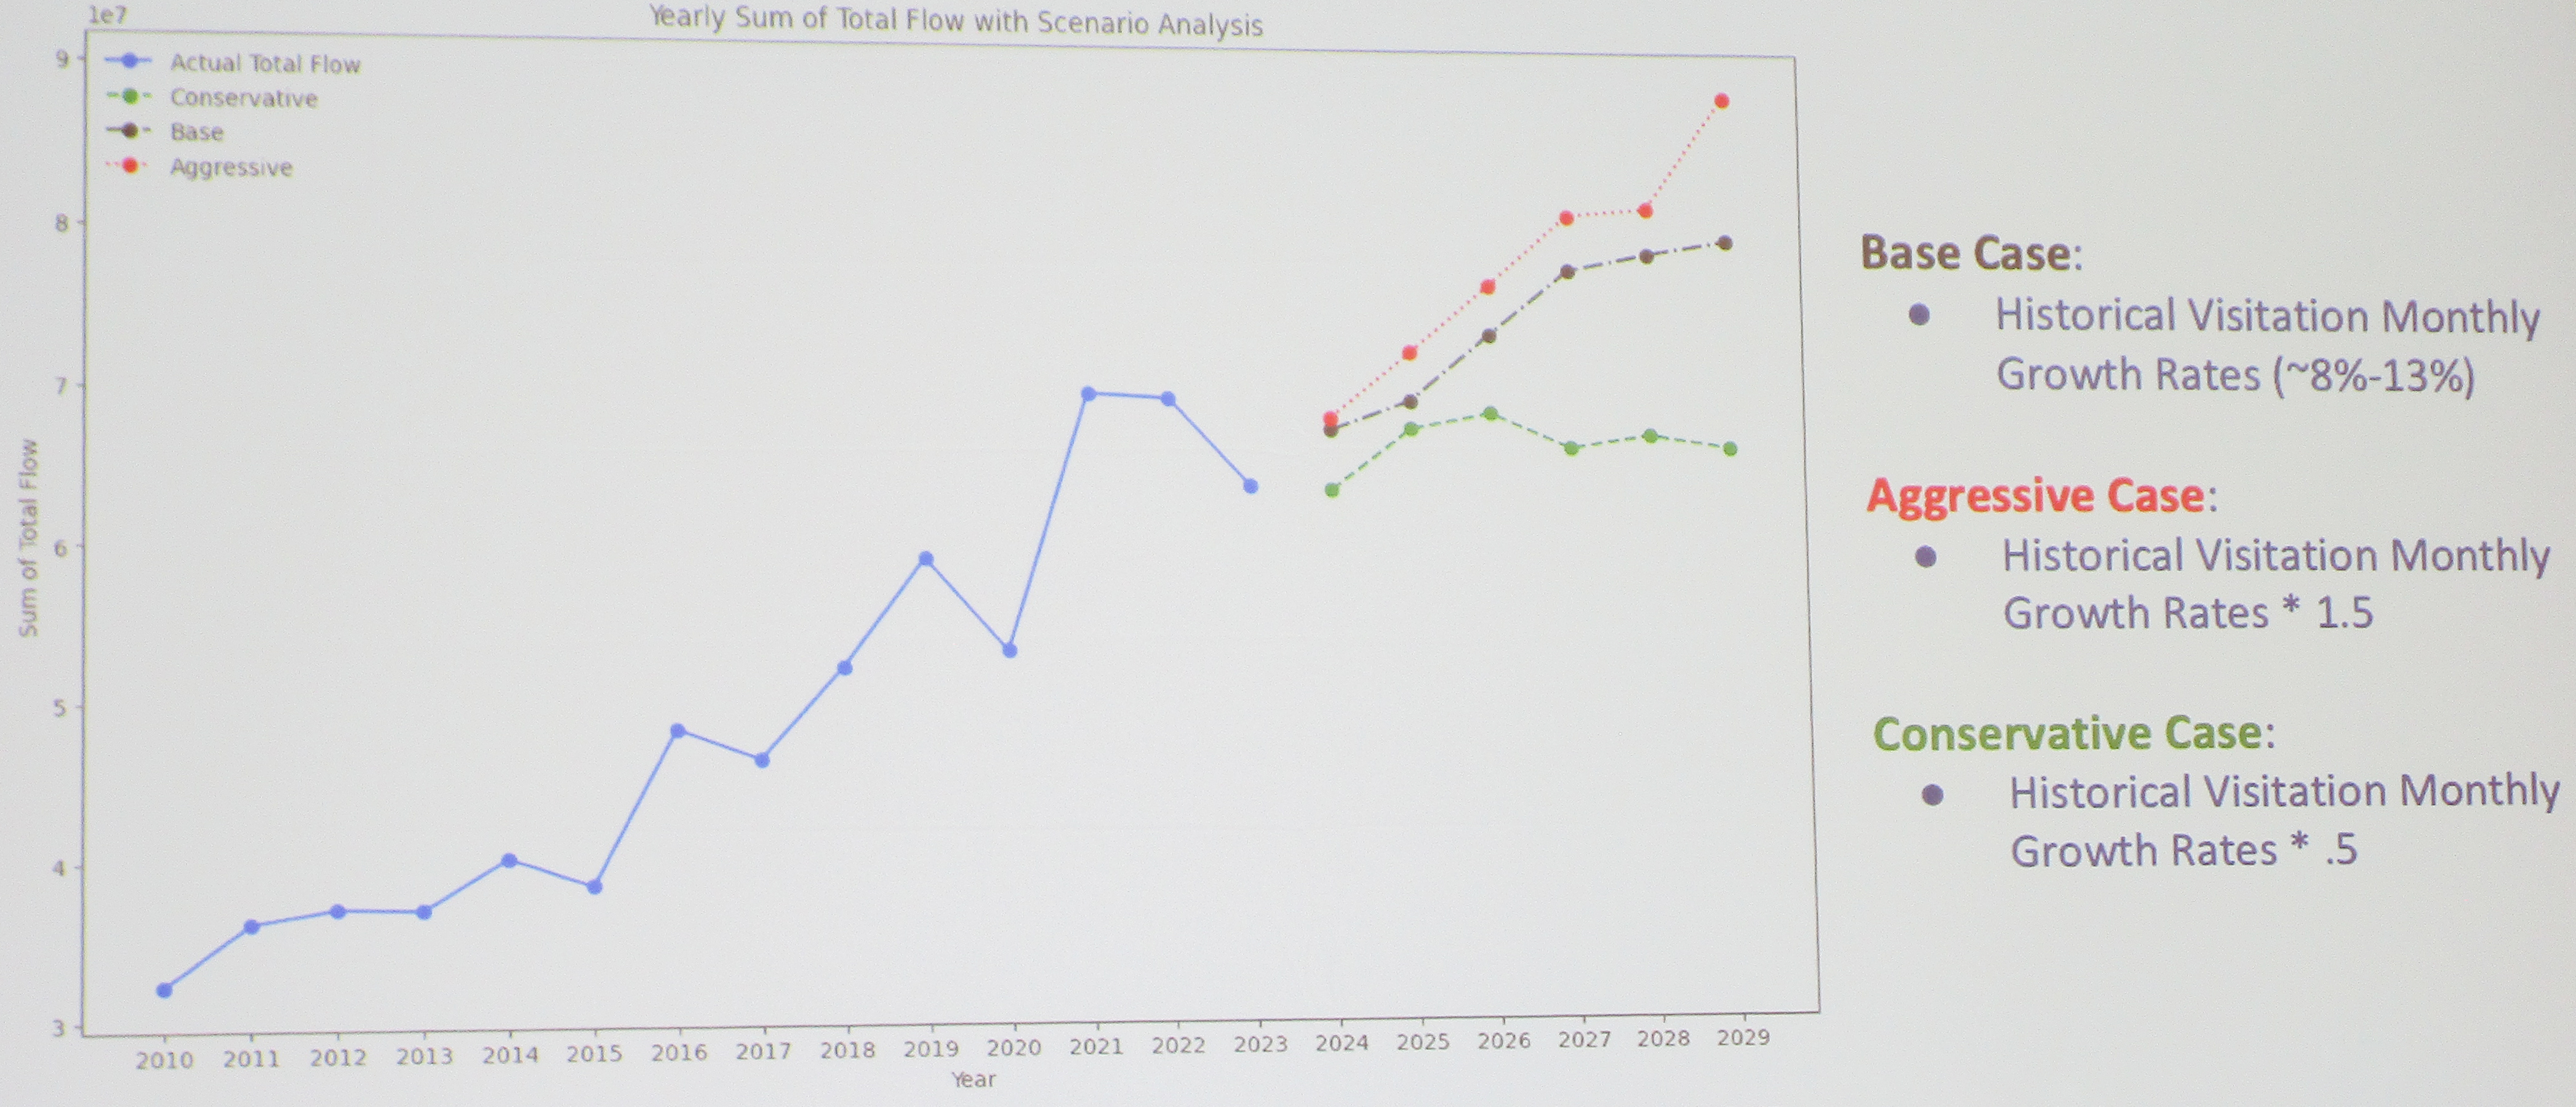
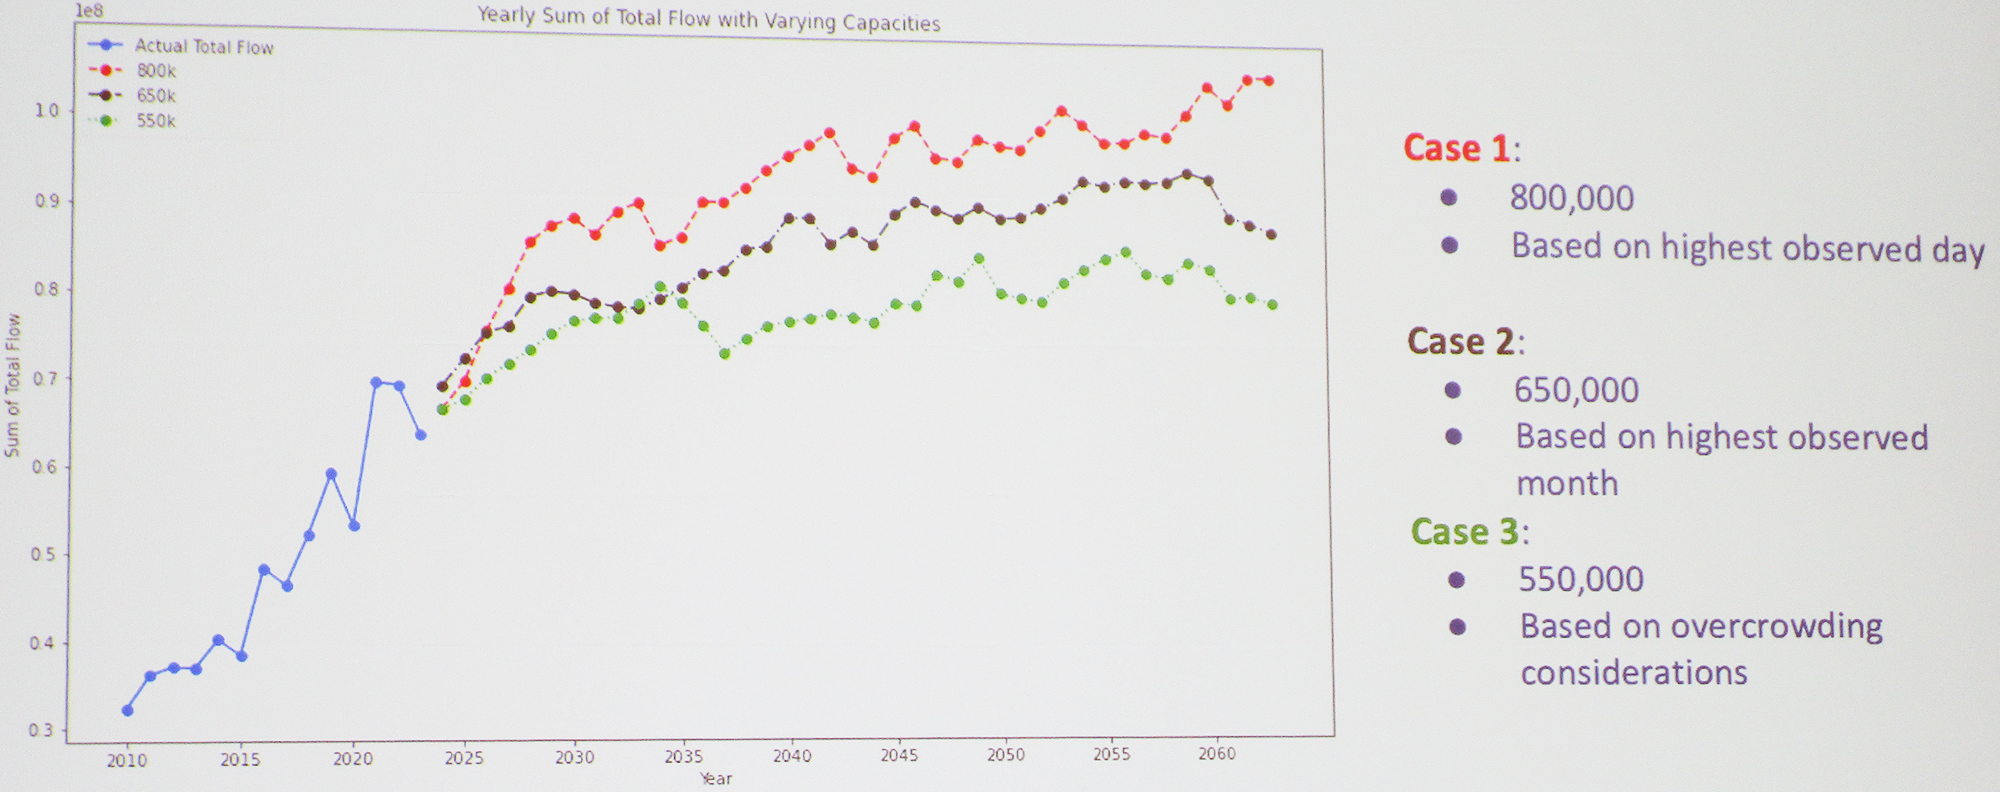
As such, the PIC Math students researched the intervention strategies that other national parks employ to limit an overabundance of visitors, including timed entry, vehicle and day-use reservations, and special use permits. While Zion is currently working to implement a more comprehensive reservation system in the coming years, the park has not yet disclosed the details of this system or its forthcoming visitation limitations. So, Krupnek charted three possible visitor capacity cases through the year 2060: 800,000 daily visitors (based on the highest observed day of traffic), 650,000 visitors (based on the highest observed month of traffic), and 550,000 visitors (to account for overcrowding conditions). Given these defined capacities, the most aggressive scenario could reach a water consumption level of 105 million gallons in 2060, the middle scenario of 650,000 daily visitors could reach 85 million gallons, and the conservative scenario could reach 75 million gallons (see Figure 3).
While Springdale’s water system can meet demand in the immediate future, adjustments may be necessary depending on Zion’s eventual limits on daily capacity. “The depletion of the towns’ water sources will depend upon how high visitation capacities are set, in addition to the growth of resident and irrigation water use,” Krupnek said. “Our linear regression model serves as a valuable tool for predicting water consumption trends. It provides insights into future water demand, allowing for informed decision-making and resource management.”
About the Author
Lina Sorg
Managing Editor, SIAM News
Lina Sorg is the managing editor of SIAM News.