
Regression and Machine Learning Offer Insights About Body Composition Benchmarks
Fundamental body composition benchmarks—such as appendicular lean mass (ALM), bone mineral density (BMD), and body fat percentage (BFP)—offer valuable information about one’s fitness and nutritional level, as well as overall health. These benchmarks are traditionally measured via dual energy-ray absorptiometry (DXA) scans, which use minimal amounts of ionizing radiation to generate images of the inside of the body. Although DXA scans are considered the gold standard in terms of accuracy when it comes to body composition and bone density, they present cost-related challenges for both hospitals and patients. For instance, the machines are more than $50,000—meaning that not all facilities have one on site—and the test itself is typically expensive, even with insurance.
Given these complications, researchers are beginning to explore possible alternatives to DXA scans that maintain similar levels of accuracy but are cheaper and more efficient. During the 2024 SIAM Annual Meeting, which is currently taking place in Spokane, Wash., Nadejda Drenska of Louisiana State University (LSU) utilized a variety of regression and supervised learning techniques to measure ALM, BMD, and BFP. “One of the questions that we’re trying to address is what can we say about alternative machine learning methods,” Drenska said. “Perhaps they can achieve reasonable accuracy when compared with DXA scans.”
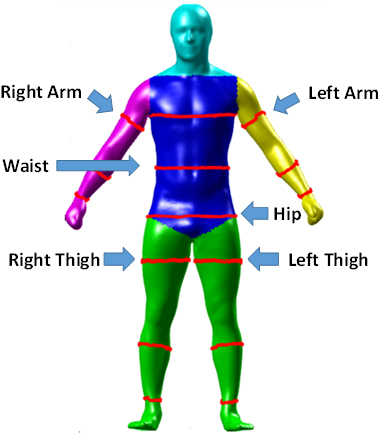
Drenska began by acknowledging contributions from the Pennington Biomedical Research Center (PBRC): the largest academic nutrition center in the world. Practitioners at PBRC conduct nutritional and aging studies and track athletes’ health metrics, among other projects. PBRC provided DXA data for 854 patients, including three-dimensional (3D) images from various angles. Several years ago, LSU’s Mathematics Consultation Clinic utilized these 3D images to write a MATLAB program, which created avatars that extracted different body measurements; these measurements are then fed into an algorithm to produce predictions for ALM, BMD, and BFP (see Figure 1).
Drenska’s initial dataset thus consisted of 854 patients with 42 variables per patient: 39 biomarkers (factors like age, height, weight, waist circumference, calf circumference, volume, and so forth) and three targets — ALM, BMD, and BFP. In this case, the biomarkers are the \(x\) variables and the targets (also called labels) are the \(y\) variables. Because she ignored data with incomplete information, Drenska ultimately ended up with 515 combined data points: 270 females and 245 males.
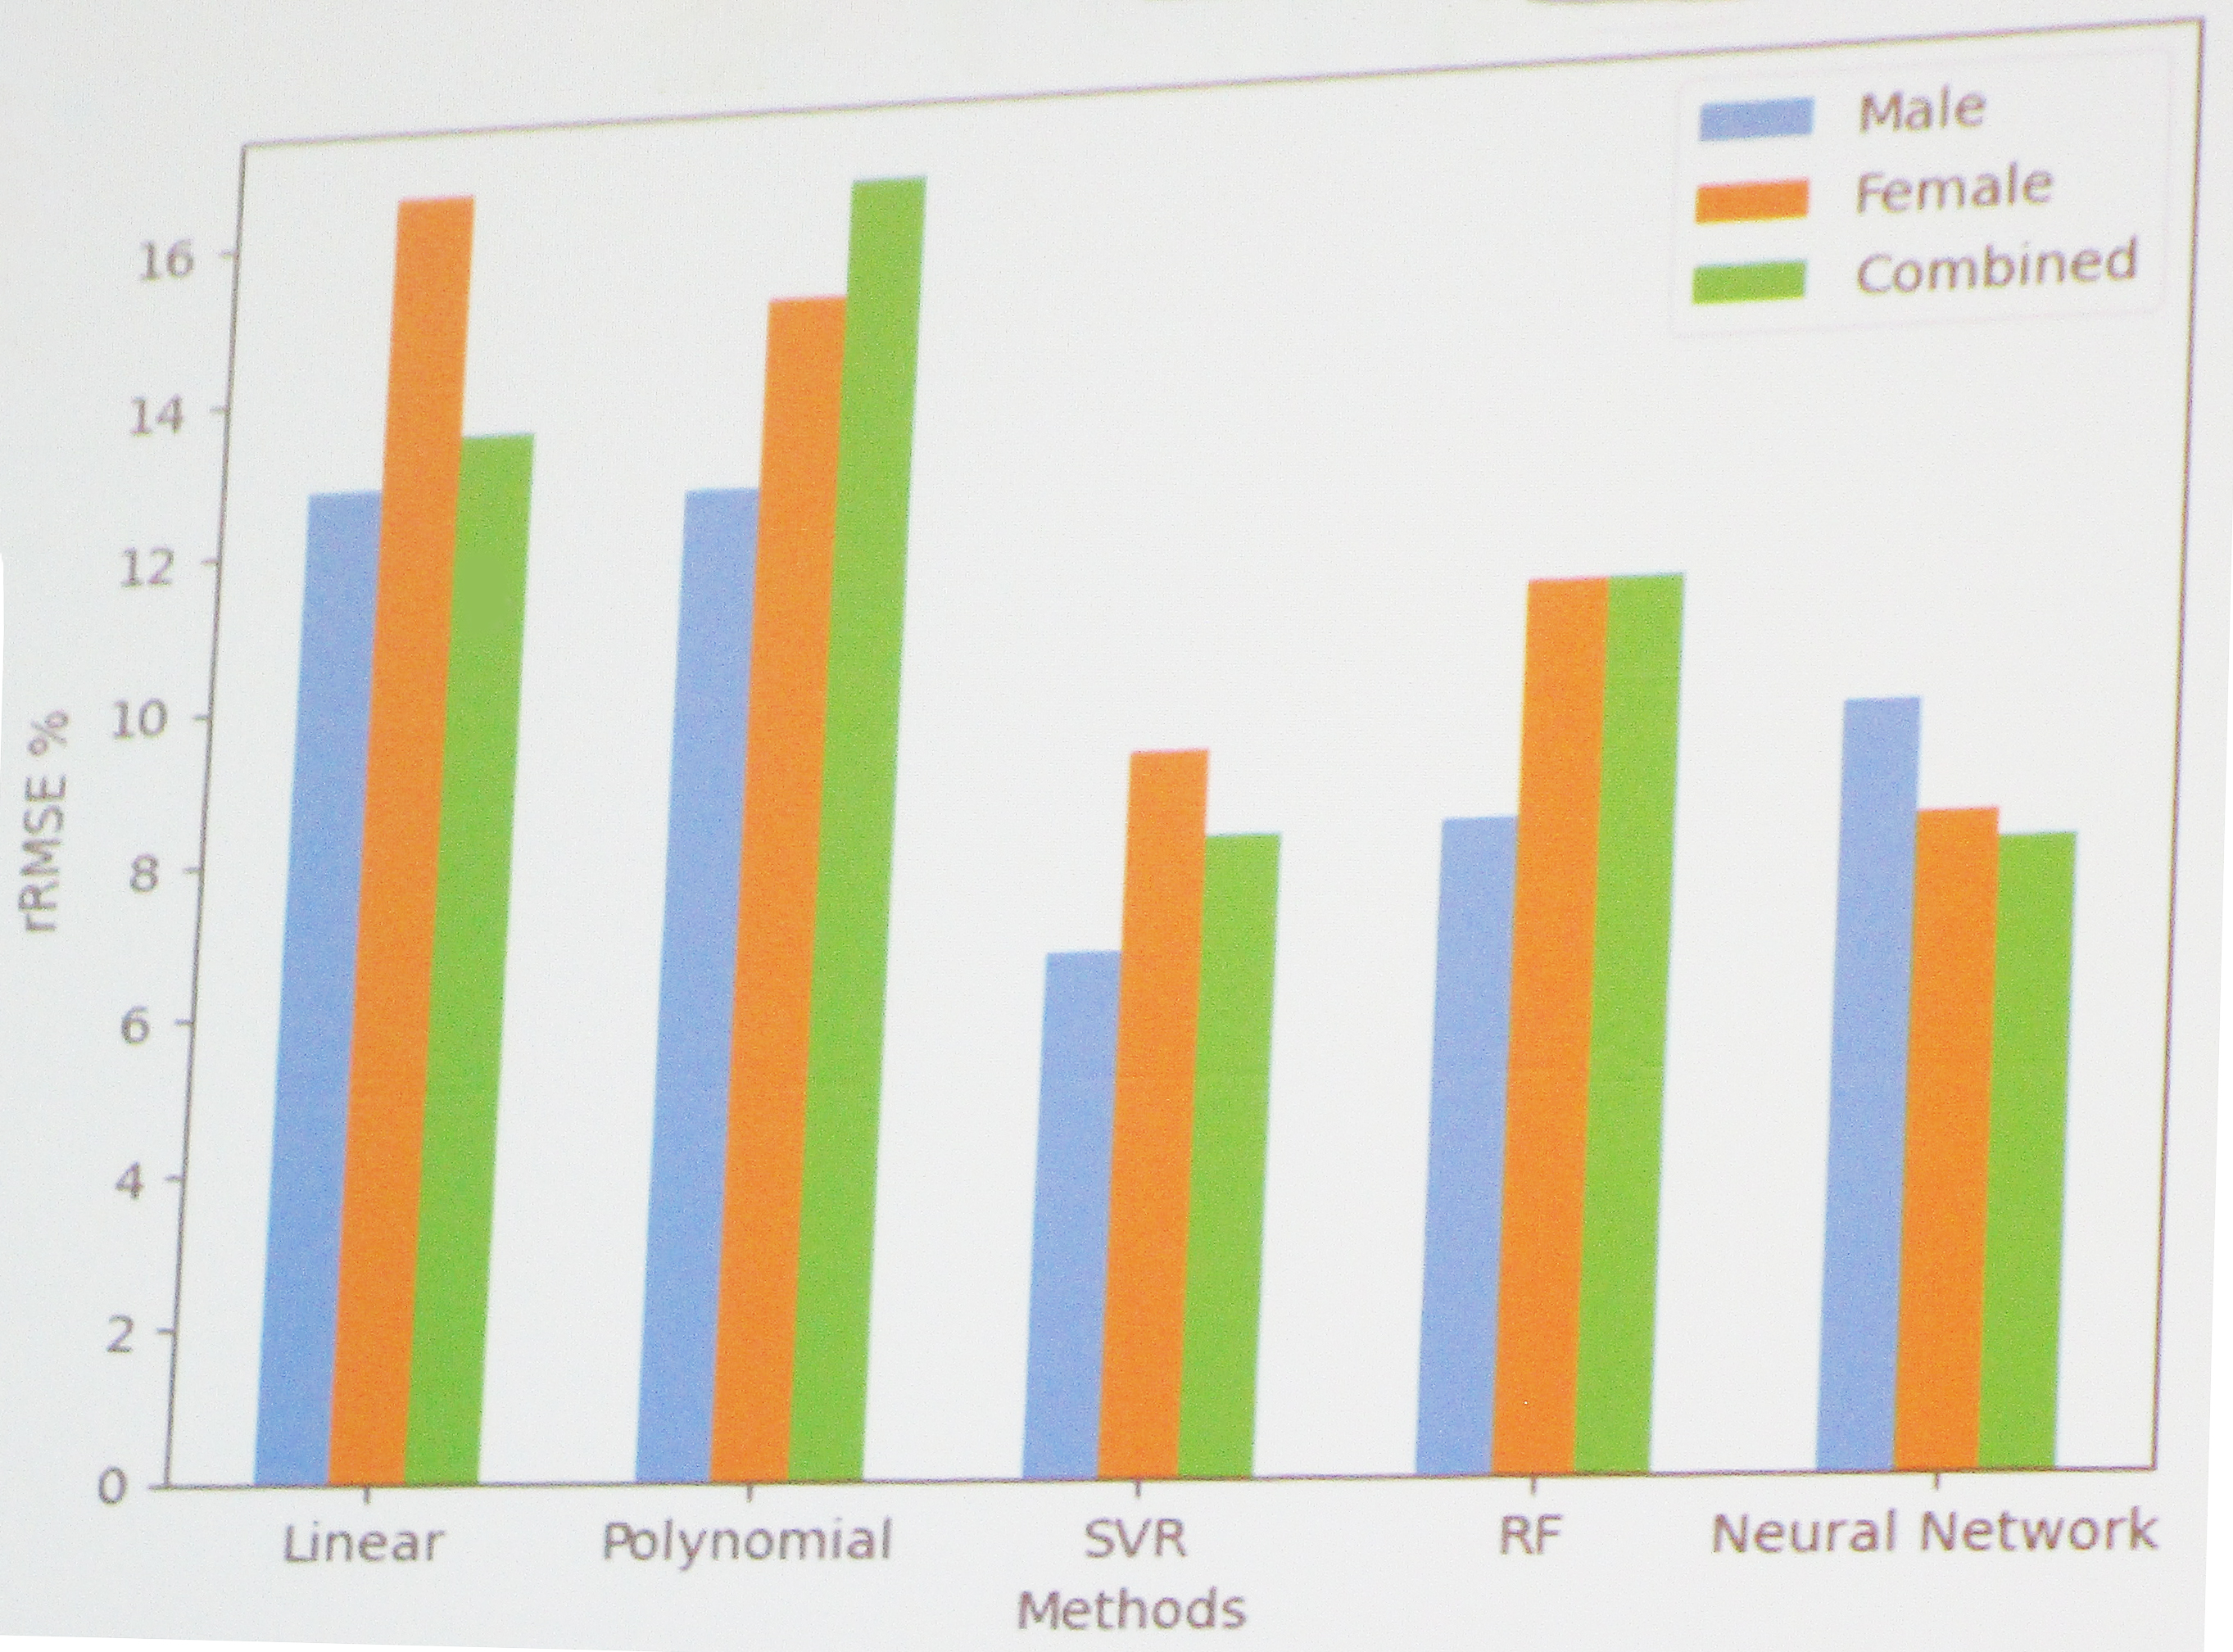
To analyze the data, Drenska employed five types of regression and machine learning methods: linear regression, polynomial regression, support vector regression (SVR), random forest, and neural networks. She then shared the results of these methods for ALM, BMD, and BFP. First, she displayed a graph of ALM distribution by sex, which indicated that men and women have different variances, medians, and averages. The top correlation for combined ALM data (both men and women) was a value of 0.91 for surface area, which was also the top correlation for both male and female data when they are separated and examined individually. Next, Drenska looked at the relative root mean square error (RMSE) percentage for ALM with each type of regression/supervised learning technique. “What we see is that linear and polynomial regression have errors that are above 12 percent,” she said, while the other three methods performed more effectively (see Figure 2).
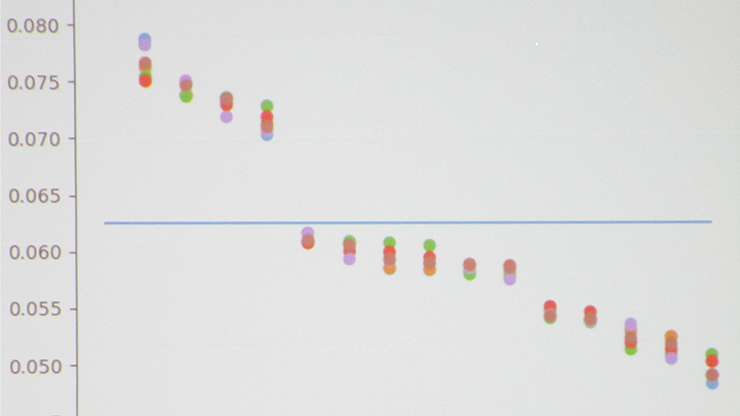
Next, Drenska moved on to BMD. The top correlation for combined male and female data was lower than ALM, with surface area at a value of .80. However, the gender breakdown revealed noteworthy differences. This time, the top correlation for male data was surface area of the right arm (with a correlation value of .86), while the top correlation for female data was height (with a correlation value of .73). This discrepancy indicates that women and men have separate values for their biomarkers. “Because we see different correlations between the data, we expect that the methods we would employ would perform with a different accuracy,” Drenska said. Finally, RMSE for BMD was smaller than for ALM: around or slightly less than eight percent.
Analysis of BFP disclosed further distinctions. The top combined correlation for BFP was waist circumference, with a correlation value of 0.57 — significantly lower than the other two benchmarks. “This is in high contrast to the top correlations of BMD and ALM,” Drenska said. “Because we have such a relatively small correlation, we expect the performance of our methods to not be as good for BFP.” This prediction is indeed correct, as the RMSE for BFP was more than 25 percent (notably, however, random forest had a RSME of at most 10 percent).
Ultimately, random forest and neural networks performed consistently better than linear regression, polynomial regression, and SVR. So, while some algorithms are getting close to predicting benchmarks as effectively as DXA, more data is necessary to further improve their outcomes. Given the difference between males and females for some algorithms, it is also important to split men and women into different groups and evaluate them separately. Drenska is also beginning preliminary work with semi-supervised learning approaches—namely the \(p\)-Laplacian—to discern the similarities between two individuals in the context of diagnostics and disease.
About the Author
Lina Sorg
Managing Editor, SIAM News
Lina Sorg is the managing editor of SIAM News.

Stay Up-to-Date with Email Alerts
Sign up for our monthly newsletter and emails about other topics of your choosing.
