
Using k-mer Analysis to Understand Bacterial Genome Data
The DNA of all living species is comprised of genetic information known as genomes, which are written as sequences of nucleotide bases. Biologists use the letters A, C, G, and T to represent these bases. Identifying and studying patterns, similarities, and differences between the genome data of different species facilitates a deeper understanding of their biological structures.
One possible method for the assessment of genomic data is called \(k\)-mer analysis. Here, \(k\)-mers are strings of nucleotide bases of length \(k\); for instance, \(k\)-mers of length three—also called 3-mers—include strings such as AAA, CAG, GCT, TCG, and so forth. During the 2024 SIAM Annual Meeting, which took place in Spokane, Wash., last week, Martin Martinez of the University of Washington utilized various forms of \(k\)-mer analysis to examine patterns within the genomic sequences of six types of bacteria: Pseudomonas, Salmonella, Streptococcus, Bacillus, Lactobacillus, and Escherichia. This work was conducted with Pacific Northwest National Laboratory as part of the Preparation for Industrial Careers in Mathematical Sciences (PIC Math) program of the Mathematical Association of America and SIAM, with support from the National Science Foundation.
Researchers can analyze the \(k\)-mer information in genome data by looking at the frequency distributions. “To do this, we computed the frequency of each \(k\)-mer in a genome sequence and plotted their distribution as a scatter plot,” Martinez said. “We also created scatter plots that show the correlations between \(1\)-mers and \(2\)-mers within a given sequence.” He used both Naive Bayes classifiers and recurrent neural networks (RNNs) to classify and evaluate the \(k\)-mers.
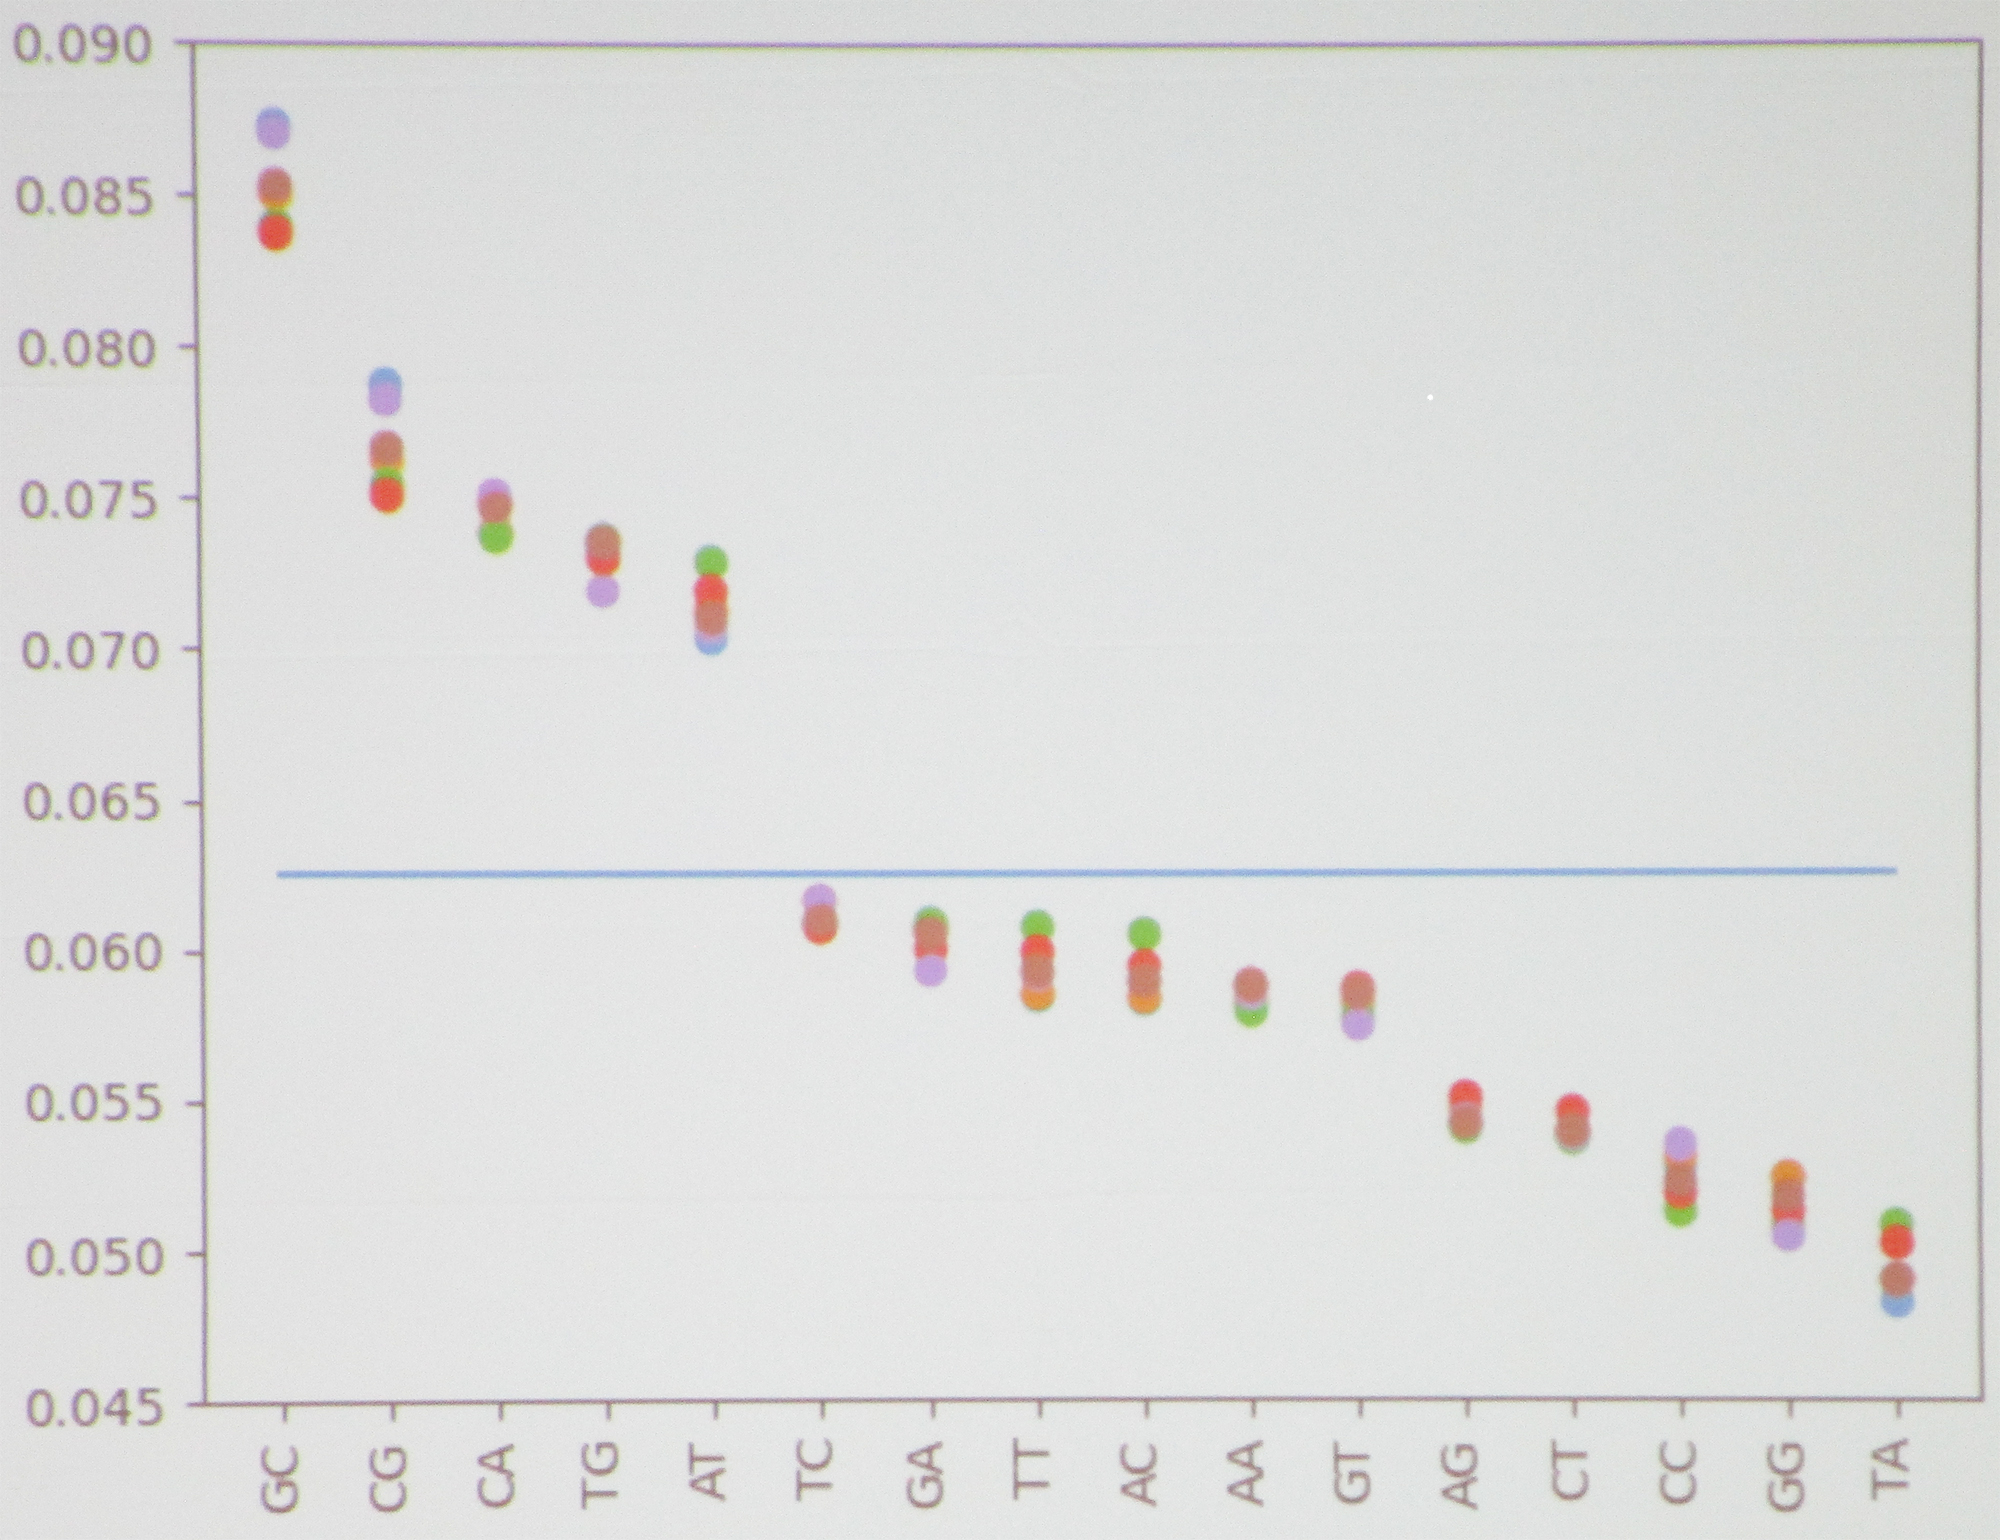
The PIC Math students began with Escherichia, a bacterium that lives in the intestines. Upon plotting the frequency of \(1\)-mers, they noticed that the distribution between different records was very close to uniform, with no obvious patterns. However, this uniformity disappeared in the distribution of \(2\)-mers. For example, GC had an exceptionally high frequency; TA had an especially low frequency; and several large gaps were present throughout the plot, such as between AT and TC (see Figure 1). “We were seeing patterns like this that are consistent across all of the records,” Martinez said. This type of pattern consistency allows researchers to more easily identify the specific genome in question.
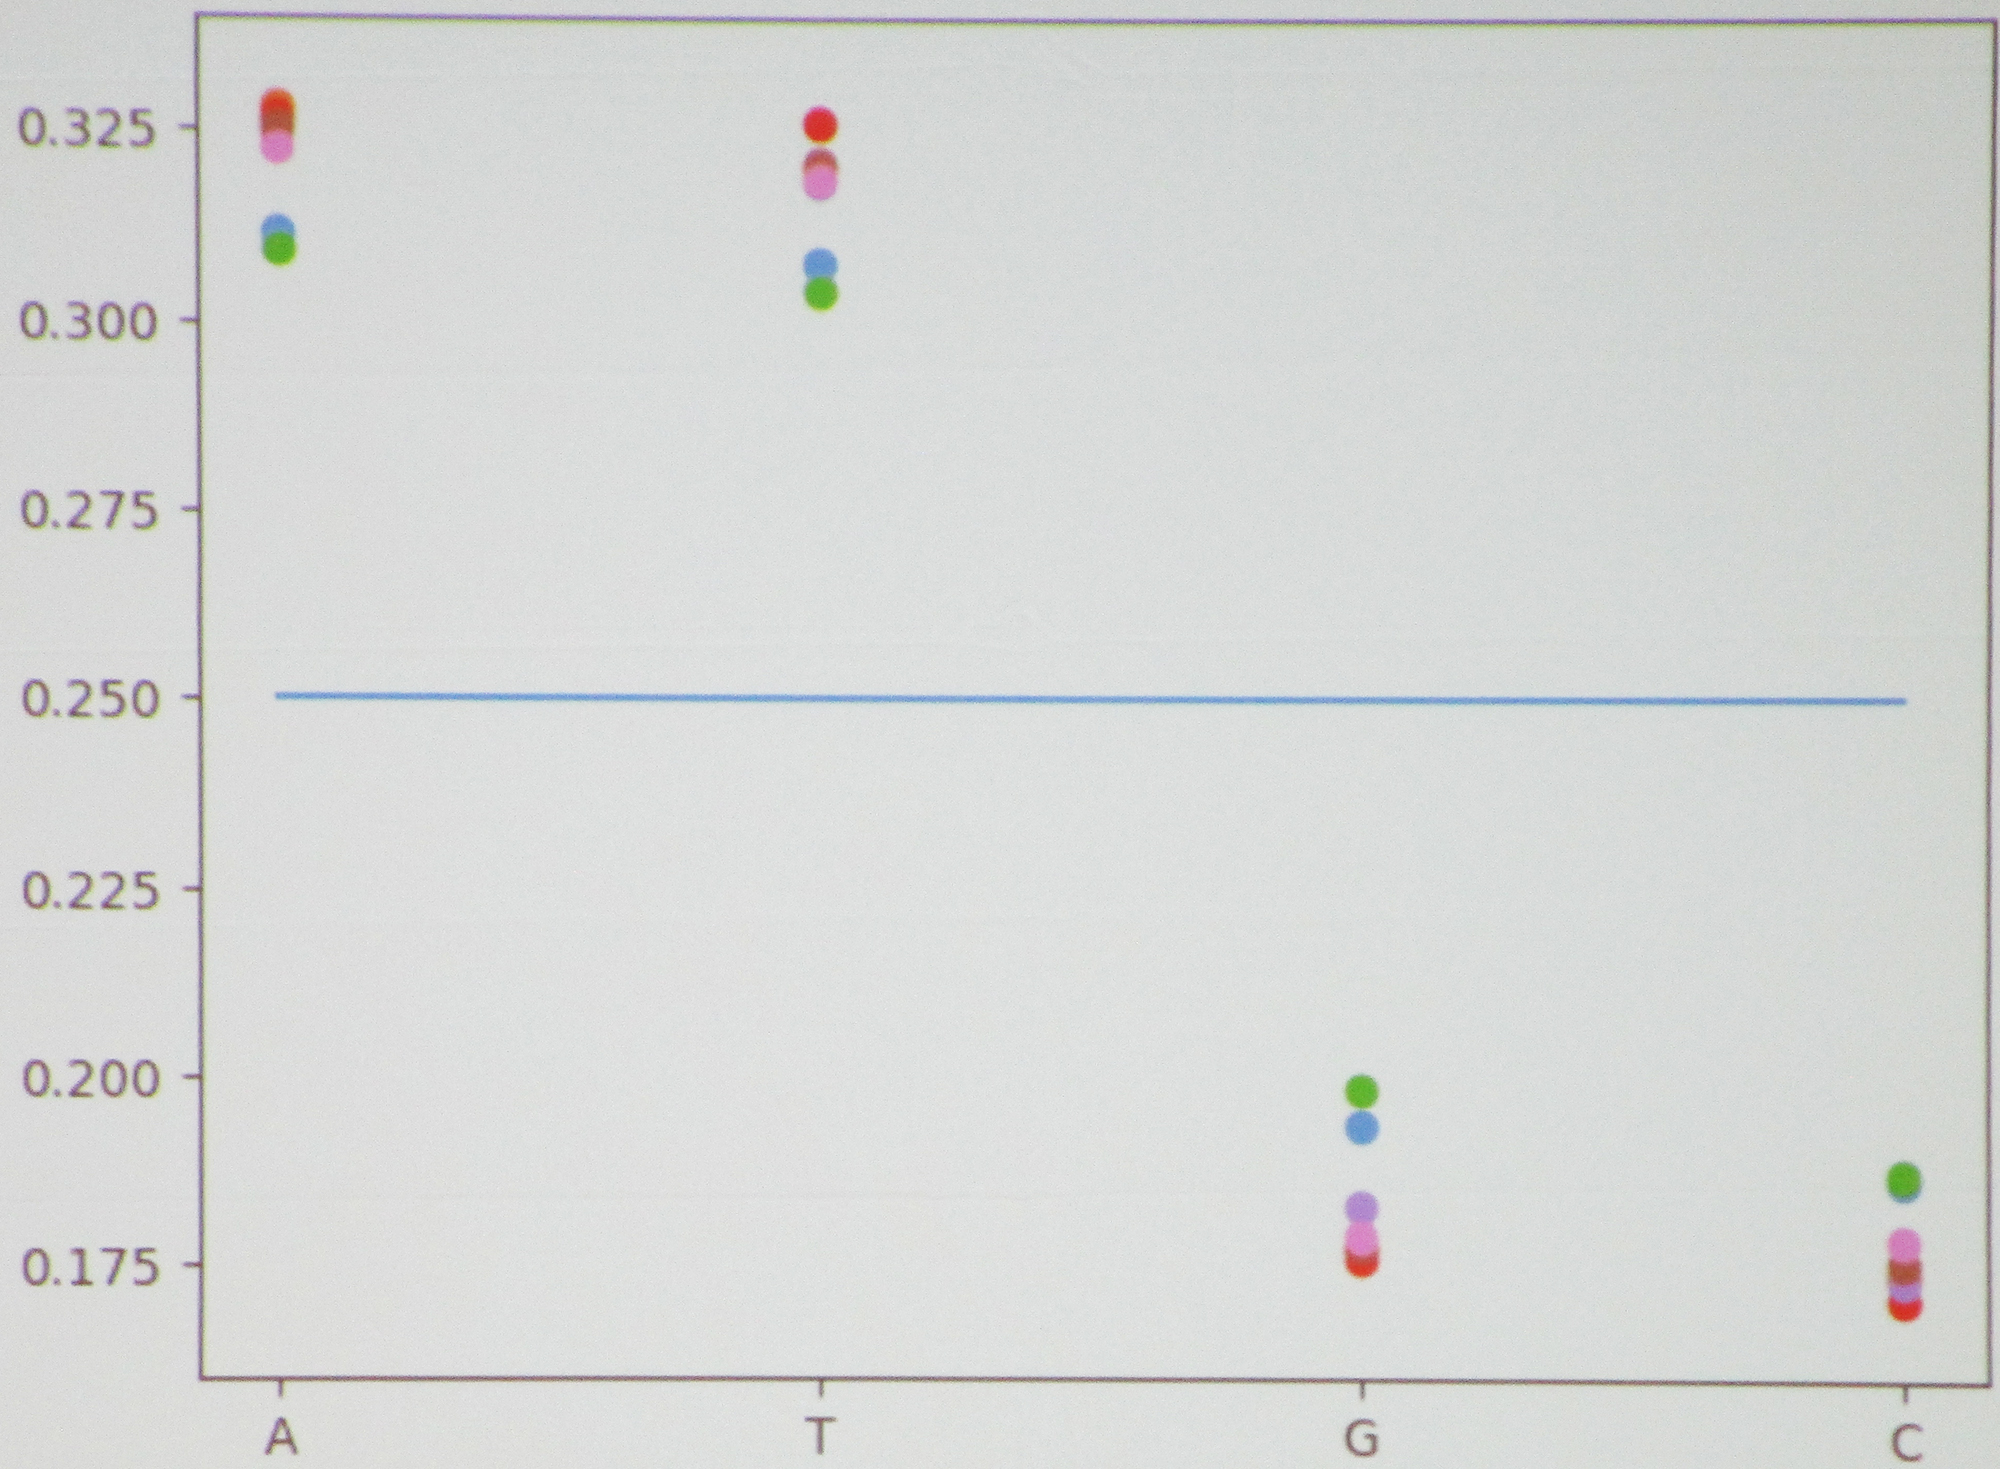
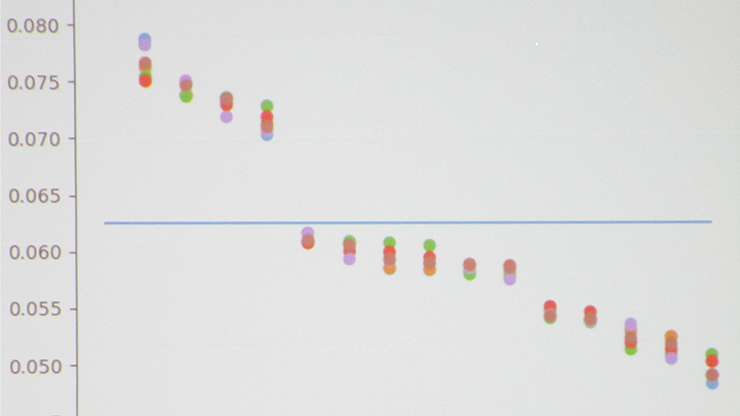
Martinez then moved to the Lactobacillus bacterium—for which the \(1\)-mers exhibited a clear nonuniform distribution (see Figure 2)—before considering the correlation between \(1\)-mers and \(2\)-mers in Bacillus versus Pseudomonas. The students had expected to see correlations in several places that did not actually transpire, causing them to wonder whether their absence was specific to these bacteria or true on a broader scale.
Ultimately, Martinez found that the use of \(2\)-mers to predict \(4\)-mers yields promising results. Yet despite a good training data performance, the model performed worse on unseen data. This was also true for the use of \(4\)-mers to predict \(5\)-mers—despite similarly positive results—leading Martinez to conclude that these models perform poorly on unseen data in general. And upon generating a genera classification report for both Naive Bayes classifiers and RNNs, he determined that RNNs did not make classification errors and was thus the more effective method for the classification of genomes.
In conclusion, Martinez demonstrated that the frequency distribution of \(k\)-mers can contain clear and consistent patterns across different records of the same genome, even at the \(1\)-mer level. However, the correlations between \(1\)-mers and \(2\)-mers do not always follow the predicted patterns that one might expect. While neural networks have seen some success in predicting the frequency distribution of \(4\)-mers from the frequency distribution of \(2\)-mers, they typically cannot predict higher-order \(k\)-mers without additional data. Nevertheless, however, RNNs were generally more successful than Naive Bayes for genome classification.
In the future, Martinez hopes to employ advanced machine learning and deep learning techniques—such as clustering and complex neural network architectures—to genome sequencing. He also plans to utilize the Basic Local Alignment Search Tool, which aligns DNA sequences and analyzes codons, to differentiate between coding and noncoding regions. And finally, he wants to analyze longer \(k\)-mer strings (up to \(21\)-mers) to obtain richer genomic information; libraries like Jellyfish, KMC, Gerbil, and KAT may prove useful for this purpose.
About the Author
Lina Sorg
Managing Editor, SIAM News
Lina Sorg is the managing editor of SIAM News.

Stay Up-to-Date with Email Alerts
Sign up for our monthly newsletter and emails about other topics of your choosing.
